This page is part of the University of Colorado-Anschutz Medical Campus’ BIOS 6618 Recitation collection. To view other questions, you can view the BIOS 6618 Recitation collection page or use the search bar to look for keywords.
Population Moments
In statistics we are often interested in estimating the average of some random variable and a summary of its variability. Oftentimes, these are represented by the mean and variance (or standard deviation). However, there are other measures that can describe the shape of a distribution, such as skewness and kurtosis.
Fortunately, these all exist under a unifying framework of the moments of a function. However, to be more useful we may modify the raw moments to be either central moments (e.g., variance) or standardized moments (e.g., skewness and kurtosis).
Let’s see a summary of these measures before diving a little deeper into skewness and kurtosis:
Skewness is a measure of the symmetry of a distribution. Symmetric distributions like the normal, \(t\), and uniform, have no skewness. However, distributions may be skewed to the right (i.e., positively skewed) where there is a greater probability of observing larger values of \(x\) or to the left (i.e., negatively skewed) where there is a greater probability of observing smaller values of \(x\).
Skewness may be important when chosing the appropriate summary measure. The mean, median, and mode are all equivalent with non-skewed distributions (an exception being the uniform, where any value in the sample space could be the mode). However, the mean and median will likely not match when skewness is present.
Kurtosis
Kurtosis is a measure of the tailedness of a probability distribution. A higher value of kurtosis leads to more extreme outliers or deviations relative to a distribution with lower kurtosis.
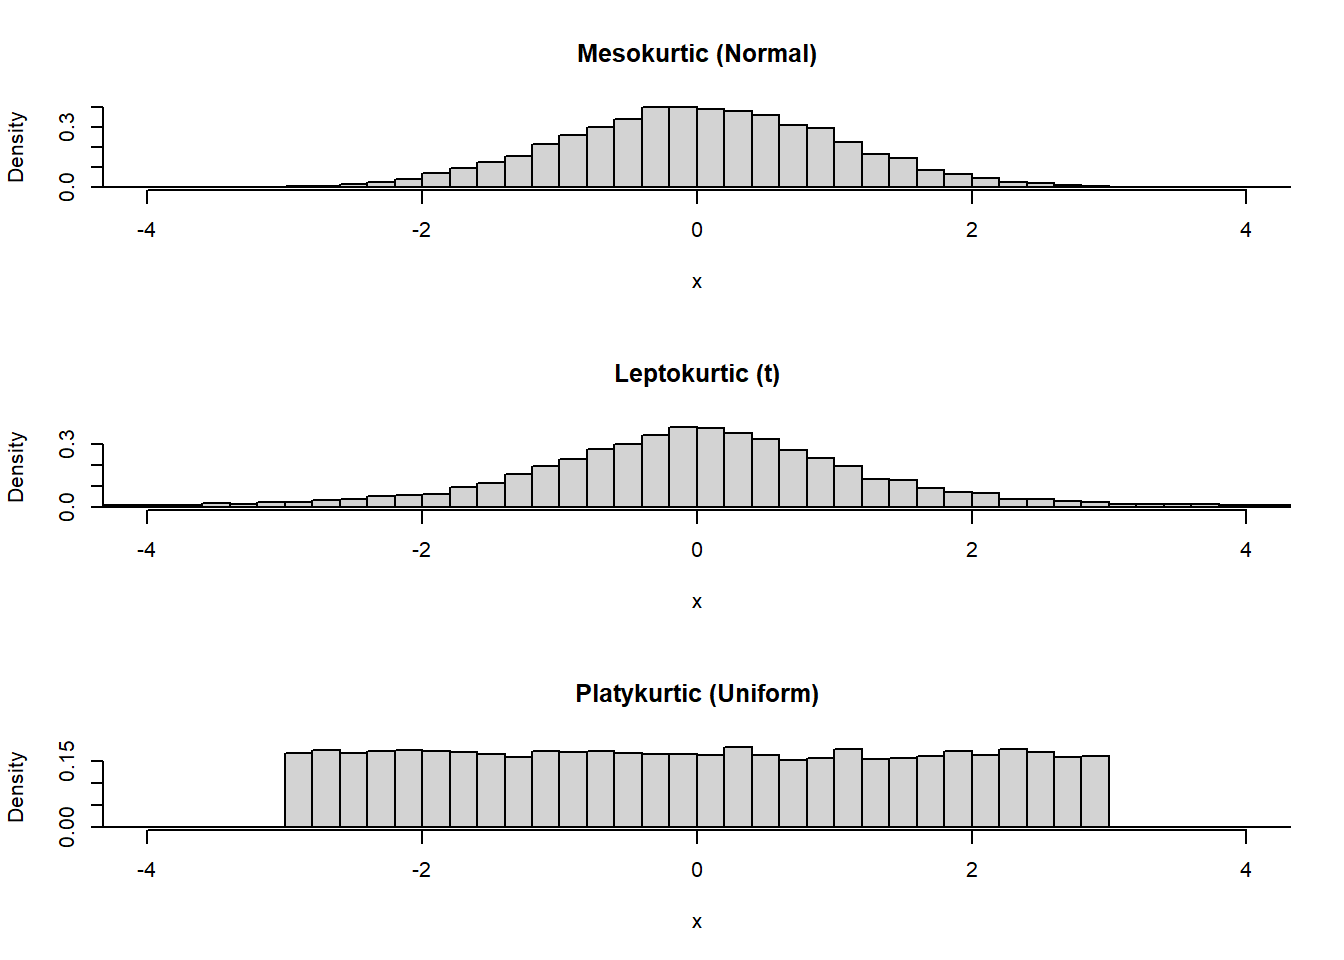
Oftentimes we are interested in describing the excess kurtosis of a distribution. To do this we have to define a gold standard, which in practice is the univariate normal distribution (whose excess kurtosis is equal to 0, also known as mesokurtic).
A platykurtic distribution has negative excess kurtosis (i.e., there is lower probability of having extreme outliers/deviations in our tails). A leptokurtic distribution has heavier/fatter tails than a normal distribution and a greater chance of observing more extreme values.
Some examples are presented below for each form of excess kurtosis:
Code
set.seed(914) # set seed for reproducibilitymeso <-rnorm(n=10000)lept <-rt(n=10000, df=3)plat <-runif(n=10000, min=-3, max=3)# estimate ranges to set breaks to be consistent for all distributionsmin_range <-floor( min(c(meso,lept,plat)) ) # round down to closest integermax_range <-ceiling( max(c(meso,lept,plat)) ) # round up to closest integerpar(mfrow=c(3,1)) # panel figure with 3 rows, 1 columnhist(meso, main='Mesokurtic (Normal)', xlab='x', ylab='Density', xlim=c(-4,4), breaks=seq(min_range,max_range,by=0.2), prob=T)hist(lept, main='Leptokurtic (t)', xlab='x', ylab='Density', xlim=c(-4,4), breaks=seq(min_range,max_range,by=0.2), prob=T)hist(plat, main='Platykurtic (Uniform)', xlab='x', ylab='Density', xlim=c(-4,4), breaks=seq(min_range,max_range,by=0.2), prob=T)
Source Code
---title: "Population Moments"author: name: Alex Kaizer roles: "Instructor" affiliation: University of Colorado-Anschutz Medical Campustoc: truetoc_float: truetoc-location: leftformat: html: code-fold: show code-overflow: wrap code-tools: true---```{r, echo=F, message=F, warning=F}library(kableExtra)library(dplyr)```This page is part of the University of Colorado-Anschutz Medical Campus' [BIOS 6618 Recitation](/recitation/index.qmd) collection. To view other questions, you can view the [BIOS 6618 Recitation](/recitation/index.qmd) collection page or use the search bar to look for keywords.# Population MomentsIn statistics we are often interested in estimating the average of some random variable and a summary of its variability. Oftentimes, these are represented by the mean and variance (or standard deviation). However, there are other measures that can describe the shape of a distribution, such as *skewness* and *kurtosis*.Fortunately, these all exist under a unifying framework of the **moments** of a function. However, to be more useful we may modify the *raw* moments to be either *central* moments (e.g., variance) or *standardized* moments (e.g., skewness and kurtosis).Let's see a summary of these measures before diving a little deeper into skewness and kurtosis:| **Moment** | **Summary** | **Type of Moment** | **Formula** | **General Description** ||:----------:|:-----------:|:------------------:|:-----------:|:---------------------------:|| 1st | Mean | Raw | $\mu = E(X)$ | Location of distribution || 2nd | Variance | Central | $\sigma^2 = E[(X-\mu)^2]$ | Variability of distribution || 3rd | Skewness | Standardized | $\gamma_1 = E\left[\left( \frac{X-\mu}{\sigma} \right)^3 \right]$ | Symmetry of distribution || 4th | Kurtosis | Standardized | $\text{Kurt}[X] = E\left[\left( \frac{X-\mu}{\sigma} \right)^4 \right]$ | Tailedness of distribution |# SkewnessSkewness is a measure of the symmetry of a distribution. Symmetric distributions like the normal, $t$, and uniform, have no skewness. However, distributions may be skewed to the right (i.e., *positively skewed*) where there is a greater probability of observing larger values of $x$ or to the left (i.e., *negatively skewed*) where there is a greater probability of observing smaller values of $x$.Skewness may be important when chosing the appropriate summary measure. The mean, median, and mode are all equivalent with non-skewed distributions (an exception being the uniform, where any value in the sample space could be the mode). However, the mean and median will likely not match when skewness is present.# KurtosisKurtosis is a measure of the tailedness of a probability distribution. A higher value of kurtosis leads to more extreme outliers or deviations relative to a distribution with lower kurtosis.Oftentimes we are interested in describing the *excess kurtosis* of a distribution. To do this we have to define a gold standard, which in practice is the univariate normal distribution (whose excess kurtosis is equal to 0, also known as **mesokurtic**).A **platykurtic** distribution has negative excess kurtosis (i.e., there is lower probability of having extreme outliers/deviations in our tails). A **leptokurtic** distribution has heavier/fatter tails than a normal distribution and a greater chance of observing more extreme values.Some examples are presented below for each form of excess kurtosis:```{r, class.source = 'fold-hide'}set.seed(914) # set seed for reproducibilitymeso <-rnorm(n=10000)lept <-rt(n=10000, df=3)plat <-runif(n=10000, min=-3, max=3)# estimate ranges to set breaks to be consistent for all distributionsmin_range <-floor( min(c(meso,lept,plat)) ) # round down to closest integermax_range <-ceiling( max(c(meso,lept,plat)) ) # round up to closest integerpar(mfrow=c(3,1)) # panel figure with 3 rows, 1 columnhist(meso, main='Mesokurtic (Normal)', xlab='x', ylab='Density', xlim=c(-4,4), breaks=seq(min_range,max_range,by=0.2), prob=T)hist(lept, main='Leptokurtic (t)', xlab='x', ylab='Density', xlim=c(-4,4), breaks=seq(min_range,max_range,by=0.2), prob=T)hist(plat, main='Platykurtic (Uniform)', xlab='x', ylab='Density', xlim=c(-4,4), breaks=seq(min_range,max_range,by=0.2), prob=T)```